 |
| Example from the Time Series Extension |
ggradar Example
Many of these extensions are not available for download through the RStudio Install Tool, but most are easy to install nonetheless. Here's a quick example getting the ggradar extension up and running.
First step, use the RStudio Install Tool to install "devtools" and "scales" (or, alternatively, run the command 'install.packages("scales")').
Second step, install the ggradar extension from the github repository using the 'devtools::install_github()" command:
devtools::install_github("ricardo-bion/ggradar", dependencies=TRUE)
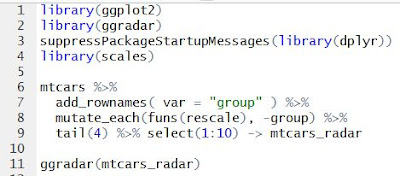
Lastly, run some example code (available on our bitbucket repo):
And the result will be a fancy radar plot, which required no more than a few key strokes.


No comments:
Post a Comment