
What about making clean, professional illustrations? Or assembling multi-panel figures? What about switching colors in an image? Or, the better question, how do I do any of these things without breaking the bank on Adobe products?
The answer to all these questions (at the very least) is in two programs: Inkscape and Gimp. Both are FREE and powerful enough to make beautiful, publication-quality art work.
In my mind, Inkscape is best for illustration and layout steps. It works with vector graphics under the hood, which can then be converted into a bitmap image later on. I mostly use Gimp for converting between file types (bitmap to TIFF, for example), changing color schemes, or general editing of non-vector images.
As a disclaimer, both of these software packages are extremely powerful and broad, and there is a whole world of things that they are capable of. The following workflow is just one example of how I go about making a figure for publication, and how I make use of these two pieces of software. The basic steps go like this:
- Create basic underlying figures using R, Matlab, or whatever plotting software is nearest to your heart.
- Create any illustrations, and figure out the layout of multi-panel figures, in Inkscape.
- Finalize the figure in Gimp, and export in the correct format.
Simple Figure Assembly in Inkscape
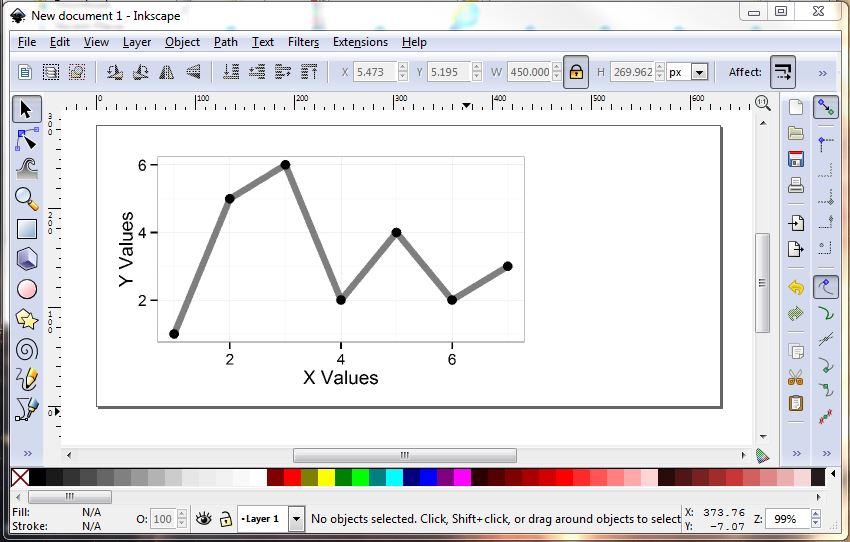
In this example, I make a simple two panel figure with a graph and an illustration.

For starters, open Inkscape and set the figure size by going to the File->Document Properties menu. Often journals give figure size guidelines, and this is where you can get started on the right foot. For this example, change the units to "cm", the width to 17.8 cm and the height to 8 cm.

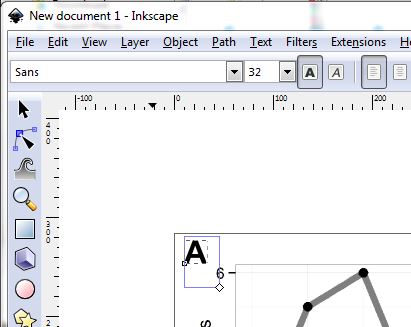
Next, we add sub-panel labels. This is accomplished by selecting the text object editing tool on the left-hand panel. When the object is selected in "text object editing" mode, it is possible to re-size the text area, change the font size, font attributes, etc. In this example, set the text to size 32 in the default font, and set to bold. When selected in the "select and transform objects" mode, you can move, copy/paste, rotate and re-size the text as though it were an image.
Copy and paste the "A" label once you've got the settings figured out, and move this copy of "A" over to the right-hand panel. Select the object in "text editing" mode, and replace the "A" with a "B". To make sure the "B" is lined up with the "A", select the "A", and check its position on the y-axis (in this case, 253.573 px). Re-select the "B", and manually type in the correct y-axis position.

Now, let's make a simple line drawing. The illustration capabilities of Inkscape extend far beyond what will be shown here. This should get you started though. First, draw two three circles, arranged as the points on a triangle. Select the "create circles, elipses and arcs" tool from the left-hand panel. Once you've drawn one, copy and paste it twice to get the other two identical circles. To select multiple objects at once, hold down shift while clicking multiple objects (or click and drag a box select around all the objects). Change the color through the Object->Fill and Stroke menu.

To make simple line, select the "Bezier curves and straight lines" tool from the left-hand panel. Click+control key will snap lines to angles. Click and drag will create curved line segments. Once again, the Object->Fill and Stroke menu allows you to edit line properties such as color and width. In this case, set the color to black, and the line width to 2 px. The "edit paths by node" tool allows you to rearrange the nodes in your line segments, and fiddle with the curvature in curves. There are also tools for rotating objects a fixed 90 degrees, or flipping to the mirror image vertically or horizontally.
If you want to control whether an object is below or above another, use the "lower selection to bottom" or "raise selection to top" tools. You can "group" objects using the Objects->Group tool, thus allowing them to be manipulated as a single object.
Once you're happy with the appearance of your figure, export the figure as a bitmap through the File->Export Bitmap menu. Export the page and choose the resolution. In this case, the journal probably specifies a minimum resolution, which we'll assume is 300 dpi. Note the figure dimensions when you select the resolution (in this case, the figure will be 2102 x 945 px). Click "Export", and you're done with the Inkscape portion.
Figure Finishing in Gimp
Now, open Gimp and create a new new document using File->New. Set the size to match the recently-exported bitmap "multi-panel_figure.png". Open the "Advanced Options" and set the resolution to 300 dpi on both axes. Click "OK", and the blank figure will open. Drag and drop the bitmap into this blank Gimp document. To export as a TIFF, navigate to File->Export, name the file "multi-panel_figure.tif", and select the file type as TIFF image. Sometimes journals will ask for LZW or some other TIFF compression format, which you will be given an option to select after clicking "Export".

At this point, unless I've done any other editing in Gimp, I close without saving. And voila, a publication-quality figure, with the correct dimensions and resolution.

No comments:
Post a Comment